Gantt
🔥 This feature is currently considered experimental. Try it out and give feedback by reporting bugs and suggesting new features. It’s not recommended for production use.
👥 This feature is available to all users.
The Gantt representation in Sirius Web allows you to view and manage time-related aspects of your model using a familiar timeline layout.
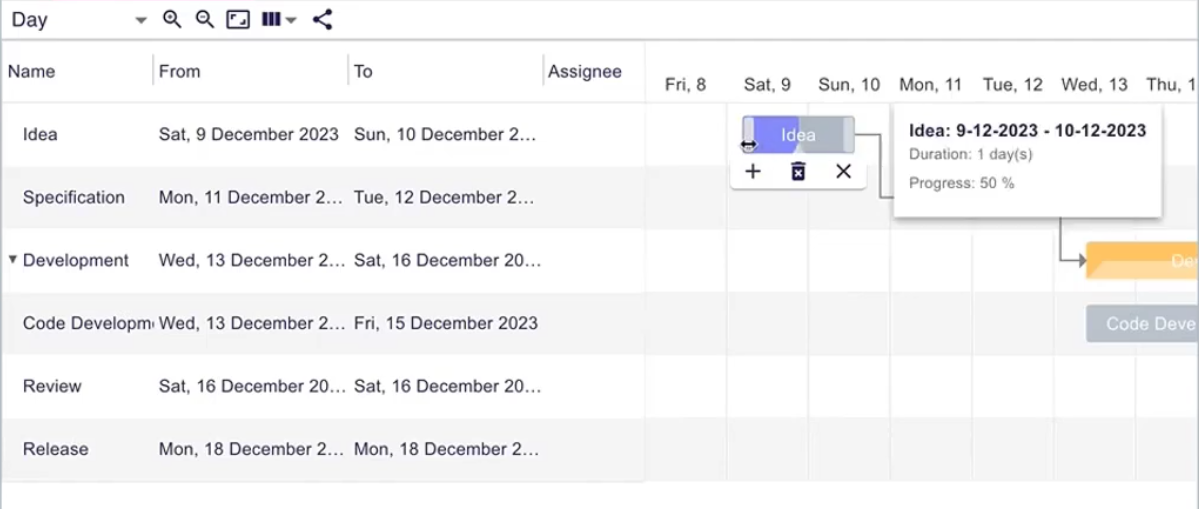
This type of representation is especially useful for planning, scheduling, and tracking activities, tasks, or events over time.
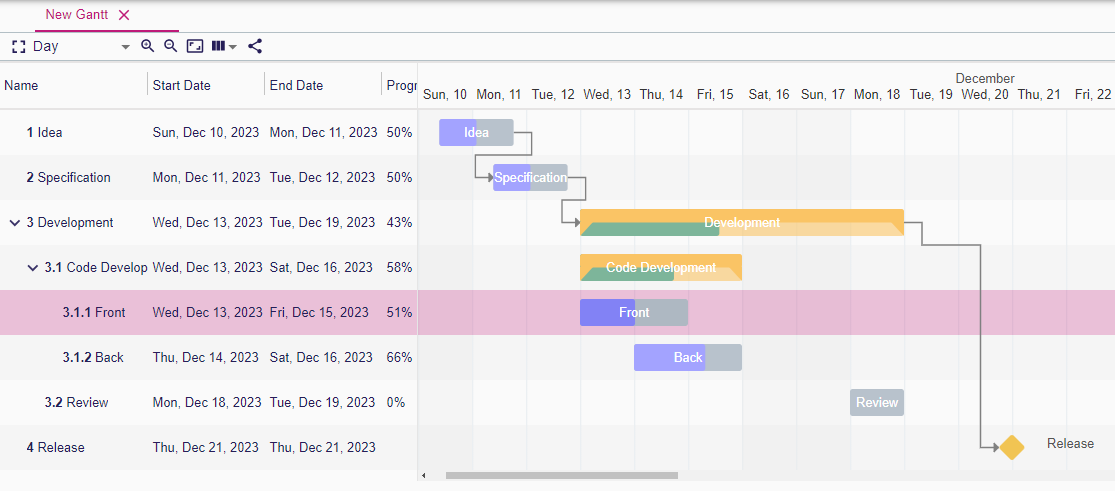
1. What You Can Do
-
Visualize elements (such as tasks or phases) as horizontal bars along a timeline.
-
See start and end dates at a glance.
-
Move or resize bars directly to adjust scheduling.
-
Expand or collapse groups to focus on specific parts of the timeline.
-
Hover or click on elements to view additional details.
-
Create and adjust dependencies between tasks to highlight sequencing constraints.
2. When to Use It
Use the Gantt representation when:
-
You need to manage time-based or sequential information.
-
You want to understand dependencies and durations visually.
-
You’re planning activities, project phases, or system behaviors.
-
You want to track progress over time in a structured way.
3. Example
In a systems engineering project, a Gantt representation might show:
-
A breakdown of major development phases (e.g., Analysis, Design, Validation)
-
Tasks assigned to each phase
-
Time windows for each activity
-
Overlaps or gaps between tasks, including their dependencies
Changes made directly in the Gantt representation update the model and can be reflected in other representations, such as diagrams or forms.
| Hover a bar to reveal start/end dates and completion ratios. Drag either end to reschedule, or draw a dependency between tasks to reflect the order of execution. |
EXAMPLE: Use the Task project template and open the “Daily Project Dev” Gantt representation to explore linked tasks, milestones, and drag-to-reschedule interactions in a ready-made dataset.
|
The available features and displayed information in the Gantt representation depend on how the representation has been configured. |
4. Task types and dependencies
A Gantt representation supports three task types:
![Task]; image::representations/gantt-task-group.png[Group]; image::representations/gantt-task-milestone.png[Milestone](../_images/representations/gantt-task.png)
-
Basic tasks with start/end dates and completion percentage (the filled portion of the bar).
-
Group tasks containing subtasks; their dates and progress can either be computed from children or defined manually.
-
Milestones that represent a specific date.
Dependencies appear as arrows between tasks:
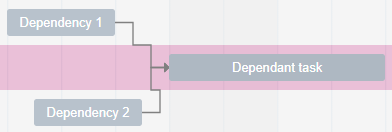
Use the circular handles on each task to create or remove relations.
5. Toolbar and navigation

The toolbar provides:
-
Full screen toggle.
-
Zoom level (Hour, Half-day, Day, Two days, Week, Month, Year).
-
Zoom in/out and fit-to-screen.
-
Column visibility menu.
-
Share link.
6. Editing tasks
Use the handles on a task bar to change the start or end date, or drag the entire bar to shift the task:
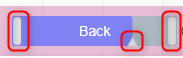
Dragging the center adjusts the progress. Dates snap according to the rounding expression defined by the specifier.
Create dependencies via the round connector next to each task:
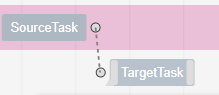
The contextual palette let you create/delete tasks or dependencies quickly:
![Task palette]; image::representations/gantt-task-dependency-palette.png[Dependency palette](../_images/representations/gantt-task-palette.png)
Tasks can also be reordered or reparented from the table:
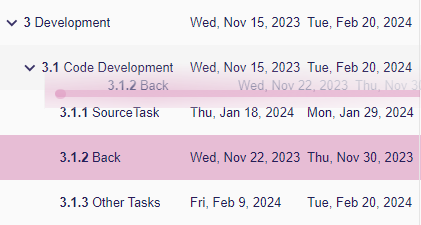
7. Table pane
The table on the left mirrors the hierarchy of tasks. You can expand/collapse rows (the state is persisted) and resize columns—column widths are remembered per representation. The toolbar’s column selector hides or shows additional data columns as needed.